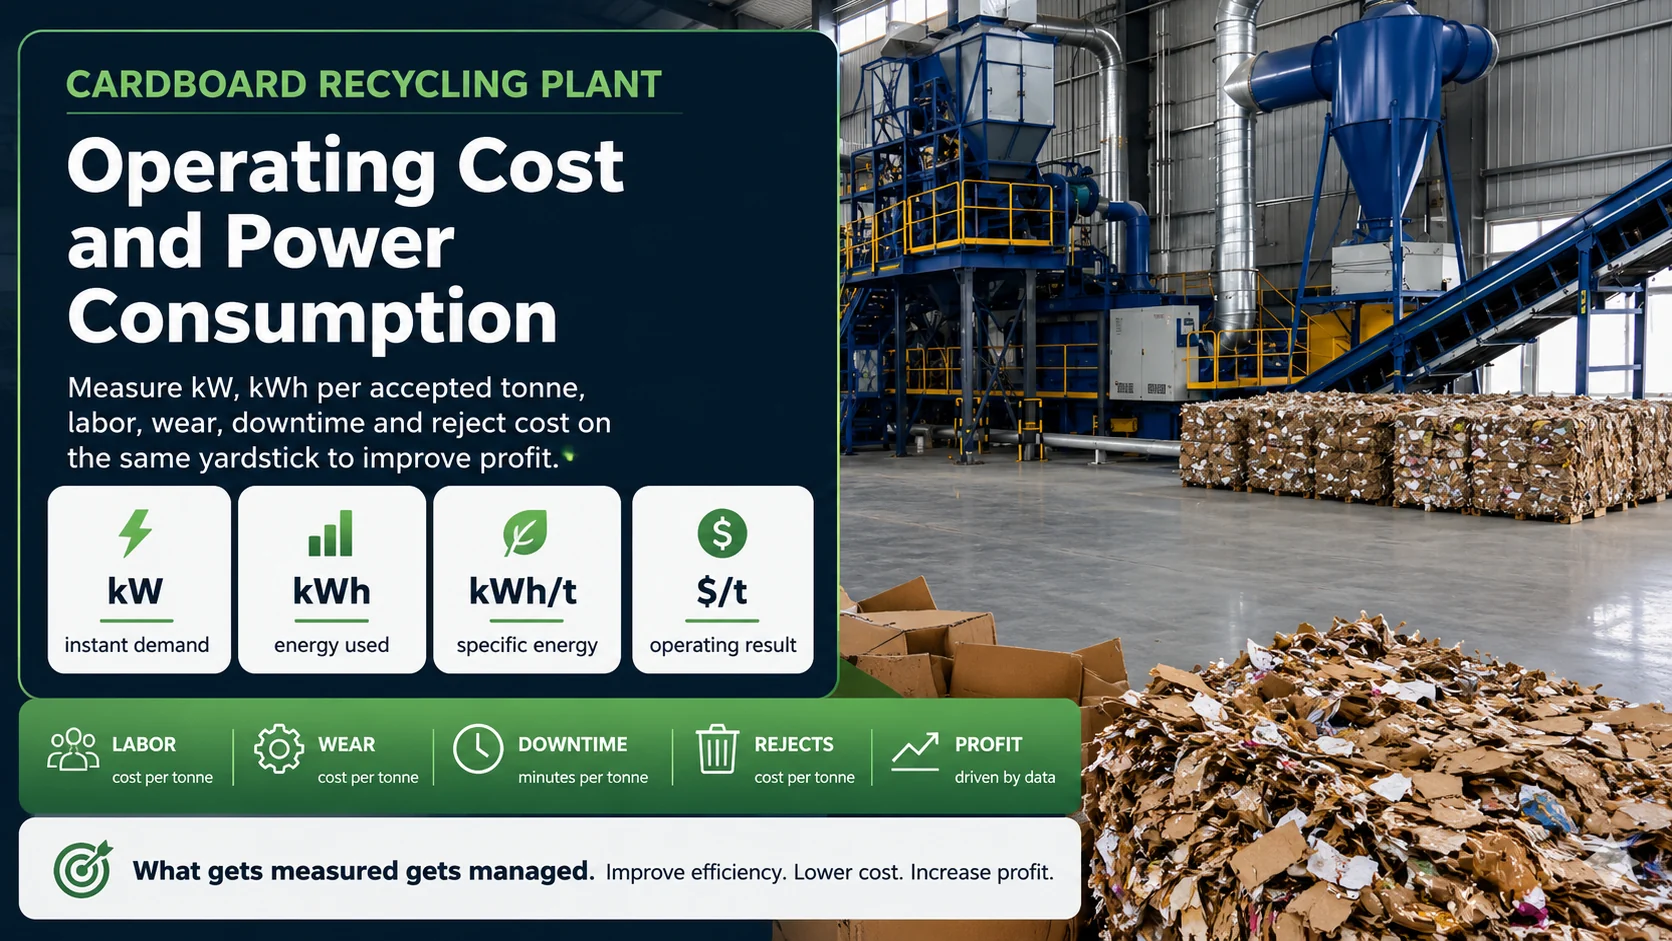
The largest motor in a cardboard recycling plant is easy to notice. The expensive losses are often less obvious: a shredder running half empty, a dust fan pulling through dirty filters, a baler waiting for material, operators removing wire from poorly staged bales, or wet OCC adding weight that never becomes saleable output.
What Actually Determines Cost per Tonne?
Cardboard recycling plant operating cost is the total cost of running the agreed process divided by the output boundary used for the business decision. For an OCC dry preparation line, the most useful denominator is normally accepted fiber-rich output or compliant bales—not wet gross feed entering the conveyor.Power consumption should be measured as total line kilowatt-hours and reported as kWh per accepted tonne. Installed motor power is needed for electrical design, but it is not a prediction of the monthly electricity bill.
A useful cost model connects the complete dry OCC process with measured power, accepted output, labor, wear, consumables, downtime and reject handling.
Start by Defining What the Plant Does—and What the Cost Includes
The YUXI waste cardboard recycling machine and plant is a dry mechanical preparation line. Depending on the project, it can combine receiving, bale opening and sorting, primary shredding, ferrous removal, metered conveying, dry fiber opening, dust collection, light-reject separation and baling. The public page also states that power and capacity must be configured from the actual feedstock and feeding method rather than one machine rating.This boundary matters. A dry OCC line is not the same as a paper mill with hydrapulping, screening, cleaning, stock preparation, sheet forming and drying. It is also not the same as a collection business that owns trucks, bins and routes.
Possible boundary
Include
Keep separate unless deliberately allocated
Dry processing line
Plant operators, electricity, wear parts, dust bags, baling wire, routine maintenance, reject handling and in-plant material movement
Dry line costs plus building labor, forklift operation, rent, insurance, supervision, compliance and shared utilities
Corporate overhead or sales costs not caused by the site
Delivered accepted output
Facility operating cost plus outbound loading, freight, buyer deductions and disposal of rejected loads
Revenue and capital repayment unless the model is intended to show full cash cost
The industrial cardboard recycling process guide explains the physical stages and the boundary between dry preparation and downstream papermaking. Use that process map before assigning costs to departments or machines.
Installed Power, Running Demand and Energy Consumption Are Different Numbers
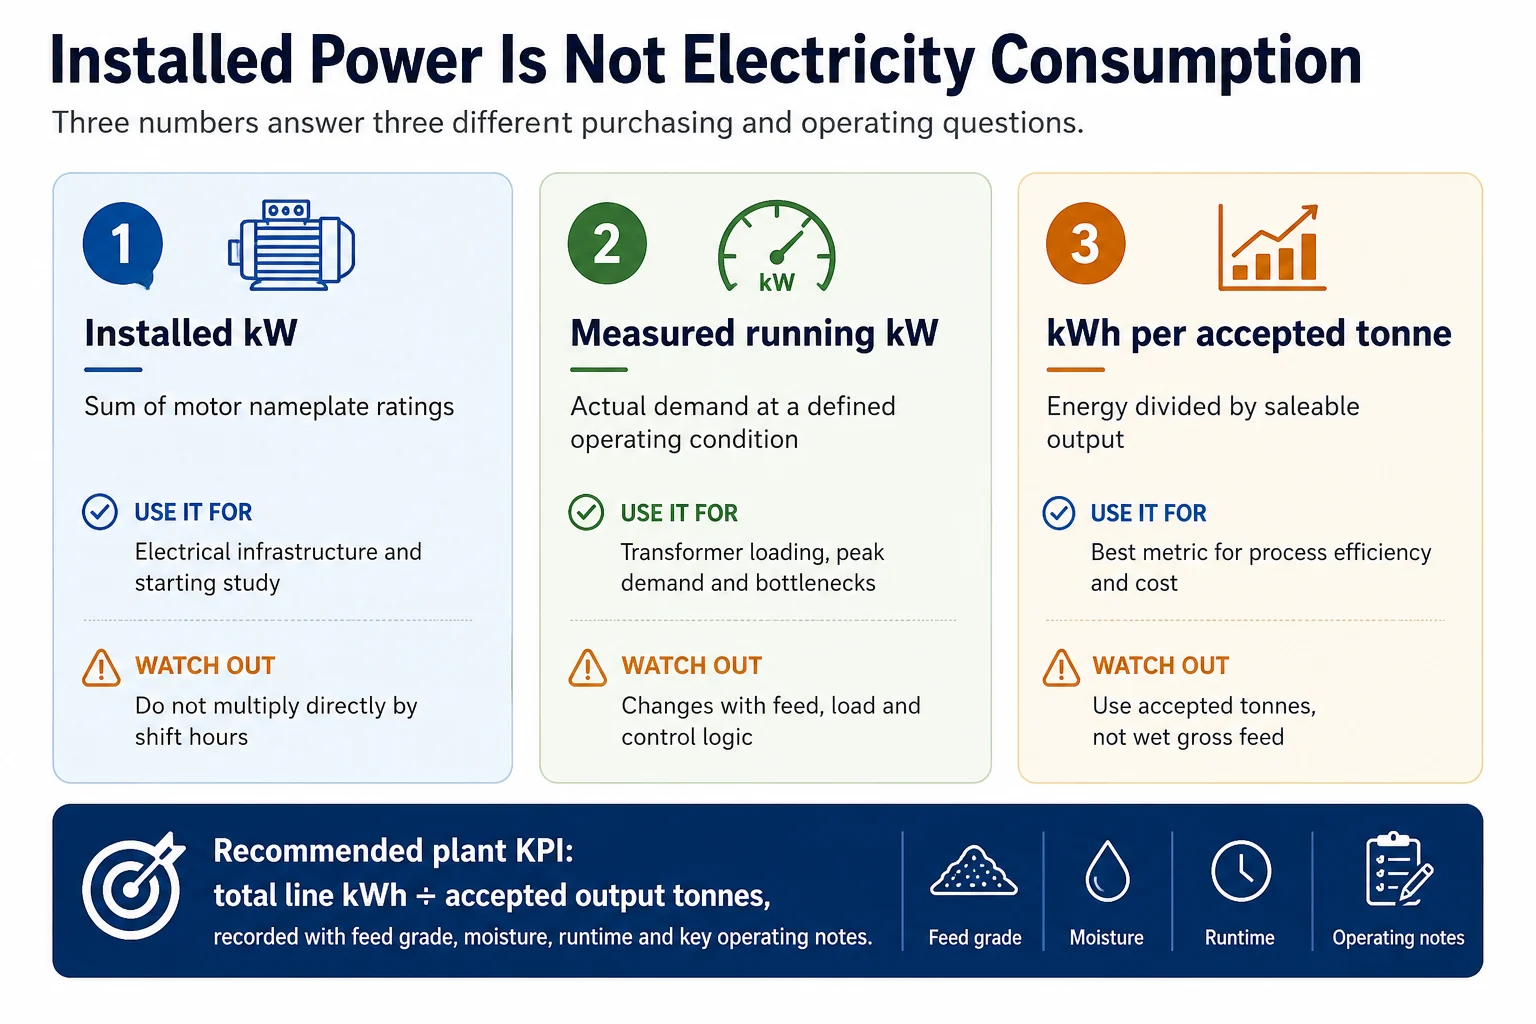
A quotation may list motors in kilowatts. An electrician uses those ratings to review feeders, cable, transformer capacity, voltage drop, starting method and protection. An operations manager needs different information.Installed kW supports electrical design; measured kW shows instantaneous demand; kWh per accepted tonne shows how much electricity the line used to make the saleable output.
Term
Meaning
Best use
Installed power (kW)
The combined rated power of connected motors and auxiliaries
Preliminary electrical infrastructure and maximum connected-load review
Measured demand (kW)
Instantaneous or interval-average electrical input while the plant operates
Peak-demand management, transformer loading and process diagnosis
Energy consumption (kWh)
Power integrated over time
Utility energy charges and shift or monthly consumption
Specific energy consumption (kWh/t)
Line energy divided by tonnes produced on a defined boundary
Comparing operating conditions, shifts, feed grades and improvement projects
Specific energy consumption SEC (kWh/accepted t) = total metered line energy (kWh) ÷ accepted output (t)
Do not use rated motor power as though every motor draws full load continuously. Motor input depends on mechanical load, motor efficiency, control method and operating state. The U.S. Department of Energy recommends determining motor load and efficiency from field information and calculates annual energy from input power and operating hours, followed by cost from energy use and the applicable rate.[1]
Build a Connected-Load Schedule Before Estimating the Bill
A connected-load schedule lists every material-handling and process load, not just the shredder. It should identify motor rating, starting method, expected operating state, control mode and whether loads run together.
Load group
Information to request
Why it changes the estimate
Receiving and conveyors
Motor ratings, number of conveyors, incline, loading method, speed control and run logic
Long conveyors can accumulate significant idle hours when interlocks are poorly sequenced.
Bale opening and pre-sorting
Opener drive, hydraulic power unit, wire-removal method and batch rhythm
Labor and intermittent hydraulic demand may be more important than average motor power.
Primary shredder
Drive rating, load current, reverse frequency, idle current and representative throughput
Starved feeding and repeated reversals can raise kWh per tonne even when peak kW is acceptable.
Magnetic and light-reject separation
Separator motor, air fan, rotary valve and duty cycle
Optional separation adds power but can reduce reject cost or improve buyer acceptance.
Dry fiber opener
Drive rating, feed rate, opening intensity and recirculation
Finer or more intensive opening may consume more energy and increase wear.
Dust collection
Fan rating, airflow, static pressure, filter area, cleaning system and VFD strategy
Fan demand can be substantial and dirty filters increase resistance.
Baler
Hydraulic power, cycle time, tie system, standby logic and bale target
The baler is cyclic; poor buffering can make upstream equipment idle while the press finishes a cycle.
Auxiliaries
Air compressor, lighting, HVAC, controls, chargers and workshop services
These loads may not appear in a machine list but still appear on the utility meter.
Calculate Electricity Cost from the Tariff, Not One Average Price
Many commercial and industrial tariffs contain more than an energy charge. Depending on the utility and contract, the bill may include customer charges, time-of-use energy, peak-demand charges, power-factor adjustments, taxes and other riders. DOE guidance notes that demand-charge structures can use the current peak, time-of-use peak or a look-back ratchet, so an occasional high demand can affect more than one billing period.[2]
Monthly energy charge Σ (metered kWh in each tariff period × that period's $/kWh)
For a new plant, request the local utility tariff and a preliminary load study before finalizing the electrical design. For an operating plant, interval data is much better than a monthly total because it shows whether peak demand occurs during startup, simultaneous bale handling, a jam recovery or another short event.
Submeter the process, then reconcile it with the main meter
Portable power analyzers or permanent submeters can separate the shredder, opener, dust fan, baler and auxiliaries. The sum should be reconciled with the facility meter over the same time window. A large gap often reveals lighting, charging, compressors, HVAC or another shared load that was omitted from the process estimate.
An Illustrative Electricity Calculation
The following example demonstrates the method. It is not a YUXI quotation, an industry benchmark or a promise for any plant. Replace every assumption with measured data or supplier test results for the actual material.
Illustrative input
Value
Calculation note
Metered average line demand during productive operation
102 kW
Includes the agreed process equipment and auxiliaries inside the submeter boundary.
Net productive runtime
7.0 h/shift
Excludes a meal break but includes normal short process interruptions.
Accepted output
22.4 t/shift
Qualified output after measured rejects.
Energy rate
$0.12/kWh
Illustrative flat energy component only.
Monthly billed demand
125 kW
Illustrative utility peak.
Demand rate
$14/kW-month
Illustrative rate.
Monthly accepted output
450 t
Used to allocate monthly demand cost.
Shift energy = 102 kW × 7.0 h = 714 kWh
Specific energy = 714 kWh ÷ 22.4 t = 31.9 kWh/accepted t
Illustrative electricity cost = $3.83 + $3.89 = $7.72/accepted t
The example shows why a buyer cannot calculate the bill from 102 kW alone. Runtime, accepted output and tariff structure all matter. A plant with the same average demand but twice the accepted output would have roughly half the energy cost per tonne. A plant with low kWh but a poorly managed monthly peak could still face a high demand charge.
Electricity Is Only One Part of Cardboard Plant Operating Cost
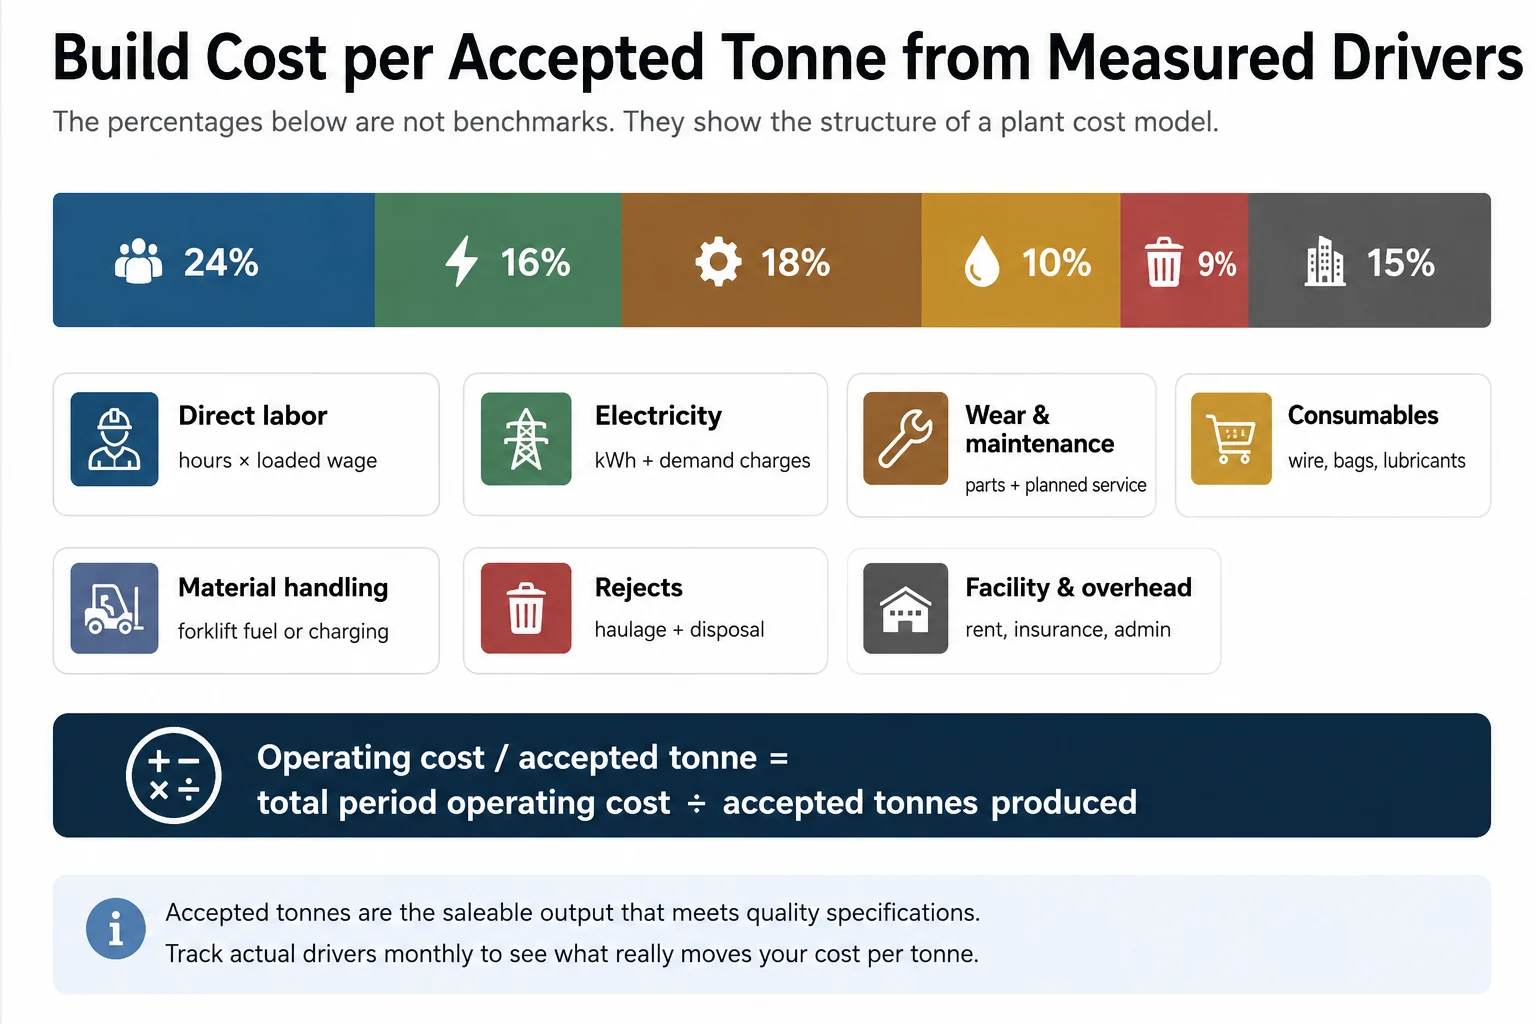
Early-stage plant budgets often include electricity and direct labor while overlooking wear parts, reject disposal, material handling and downtime. That is too narrow for a complete dry OCC line. EPA cost-accounting guidance has long treated operating cost as a combination of daily labor, utilities, maintenance, supplies and other service costs rather than one machine expense.[3]Build the cost model from measured drivers. The illustrated percentages explain the structure only; they are not universal cost shares.
Cost category
Recommended driver
Typical records
Direct labor
Productive and support hours × loaded hourly cost
Shift roster, time sheets, overtime, training and benefits
Electricity
kWh, billed demand and fixed charges
Main meter, submeters, interval data and tariff
Material handling
Forklift or loader hours × fuel, charging and maintenance cost
Hour meters, fuel logs, battery charging and service invoices
Wear parts
Part consumption per operating hour or accepted tonne
Knives, counter-knives, screens where fitted, liners, belts and bearings
Routine maintenance
Technician hours, planned parts and outside service
CMMS work orders, inspection records and lubrication logs
Consumables
Units used per bale, shift or tonne
Baling wire, filter bags, grease, hydraulic oil and cleaning materials
Reject handling
Reject tonnes × transport and disposal cost
Reject weights, container pulls, tipping invoices and buyer deductions
Facility and compliance
Monthly allocated cost
Rent, insurance, permits, testing, fire protection and housekeeping
Downtime
Lost contribution or overtime needed to recover output
Stop log, reason code, duration and missed accepted tonnes
Operating cost per accepted tonne period operating cost ÷ accepted output tonnes
Use Accepted Output, Not Wet Gross Feed, for Commercial Decisions
A line may receive 100 tonnes and produce less than 100 tonnes of accepted output. Moisture, film, wood, wire, heavily coated board, dust and other rejects consume labor and machine time but do not necessarily become saleable product.
Cost per gross feed tonne period operating cost ÷ gross feed tonnes
Cost per accepted tonne period operating cost ÷ accepted output tonnes
Both denominators are useful. Gross-feed cost supports receiving and processing comparisons. Accepted-tonne cost supports pricing, margin and buyer decisions. The OCC bale specification guide explains why grade, moisture, outthrows and prohibitive materials need a written receiving and sampling method.
Do not let water create false efficiency
Wet cardboard increases inbound weight. It can also make feeding, dry opening, storage and output acceptance less predictable. A low cost per gross tonne may therefore hide a high cost per accepted dry product. Record moisture condition with every energy and cost trial.
Seven Factors Move Operating Cost More Than a Catalog Number
1. Feed form and bale handling
Loose flattened OCC is bulky and can bridge. Compressed bales require unloading, staging, controlled wire removal, opening and inspection. One customer may need more conveyor power; another may need more labor and buffer space. The feed condition decides which cost appears first.
2. Contamination and moisture
Film, straps, wire and hard objects increase sorting time, wrapping risk, reversals and wear. Wet board adds mass without guaranteeing accepted output. Source control can be cheaper than processing a poor load.
3. Sustained utilization
A plant with high nominal t/h but frequent starvation, jams or downstream waiting spreads fixed labor and demand charges over fewer tonnes. The cardboard recycling plant capacity guide shows how continuous throughput, utilization and accepted yield combine into realistic shift output.
4. Output specification
Simple volume reduction, ordinary baling and mechanically opened fiber-rich output are not the same duty. Additional opening, separation and dust collection can add power and wear, but may be justified when the buyer pays for the resulting condition.
5. Automation and labor balance
Automation can reduce repetitive handling, but it cannot eliminate inspection, housekeeping, maintenance or abnormal-material response. A highly automated line can still lose labor hours to manual blockage clearing, contamination removal and restart work. Automation changes where labor is used; it does not remove the need for intervention.
6. Layout and internal logistics
Long transfer distances, forklift crossings, poor bale staging and insufficient finished-product space create waiting. The cardboard recycling plant layout guide should be reviewed alongside the power and labor model because a compact machine arrangement can still be an inefficient operating layout.
7. Maintenance strategy and spare-parts access
Planned knife inspection, belt tracking, bearing checks, lubrication and filter service normally cost less than repeated emergency stops. However, maintenance cost should not be hidden. Include labor, planned parts and a realistic allowance for wear under the actual contamination level.
Where Power and Operating Cost Appear in the Line
Stage
Power behavior
Common cost loss
Useful KPI
Receiving conveyor
Usually steady when loaded; low value when running empty
Idle runtime, bridging and manual rehandling
Loaded run minutes ÷ total run minutes
Bale opening and sorting
Intermittent mechanical or hydraulic demand
Wire-removal delays, unsafe intervention and uneven release
Bales opened per labor hour
Primary shredding
Variable current with material bed and reversals
Starved feed, overfeeding, dull cutters and contaminants
Shredder kWh ÷ gross tonnes through shredder
Magnetic separation
Relatively stable conveyor or drum load
Poor positioning causing carryover and downstream damage
Ferrous removal and downstream incident rate
Metering and buffer
Moderate load with variable-speed control
Surges that overload the opener or empty gaps that reduce output
Feed-rate variation
Dry fiber opening
Load follows feed rate, opening intensity and recirculation
Excessive recirculation, poor feed consistency and wear
Opener kWh ÷ accepted tonnes
Dust collection
Continuous fan demand while process points operate
Dirty filters, leakage, unnecessary airflow and poor duct design
Fan kW, static pressure and differential pressure
Baling
Cyclic hydraulic peak with standby periods
Waiting for ties, slow discharge and insufficient upstream buffer
kWh/bale, bales/hour and bale density
How to Reduce Power Consumption Without Sacrificing Output
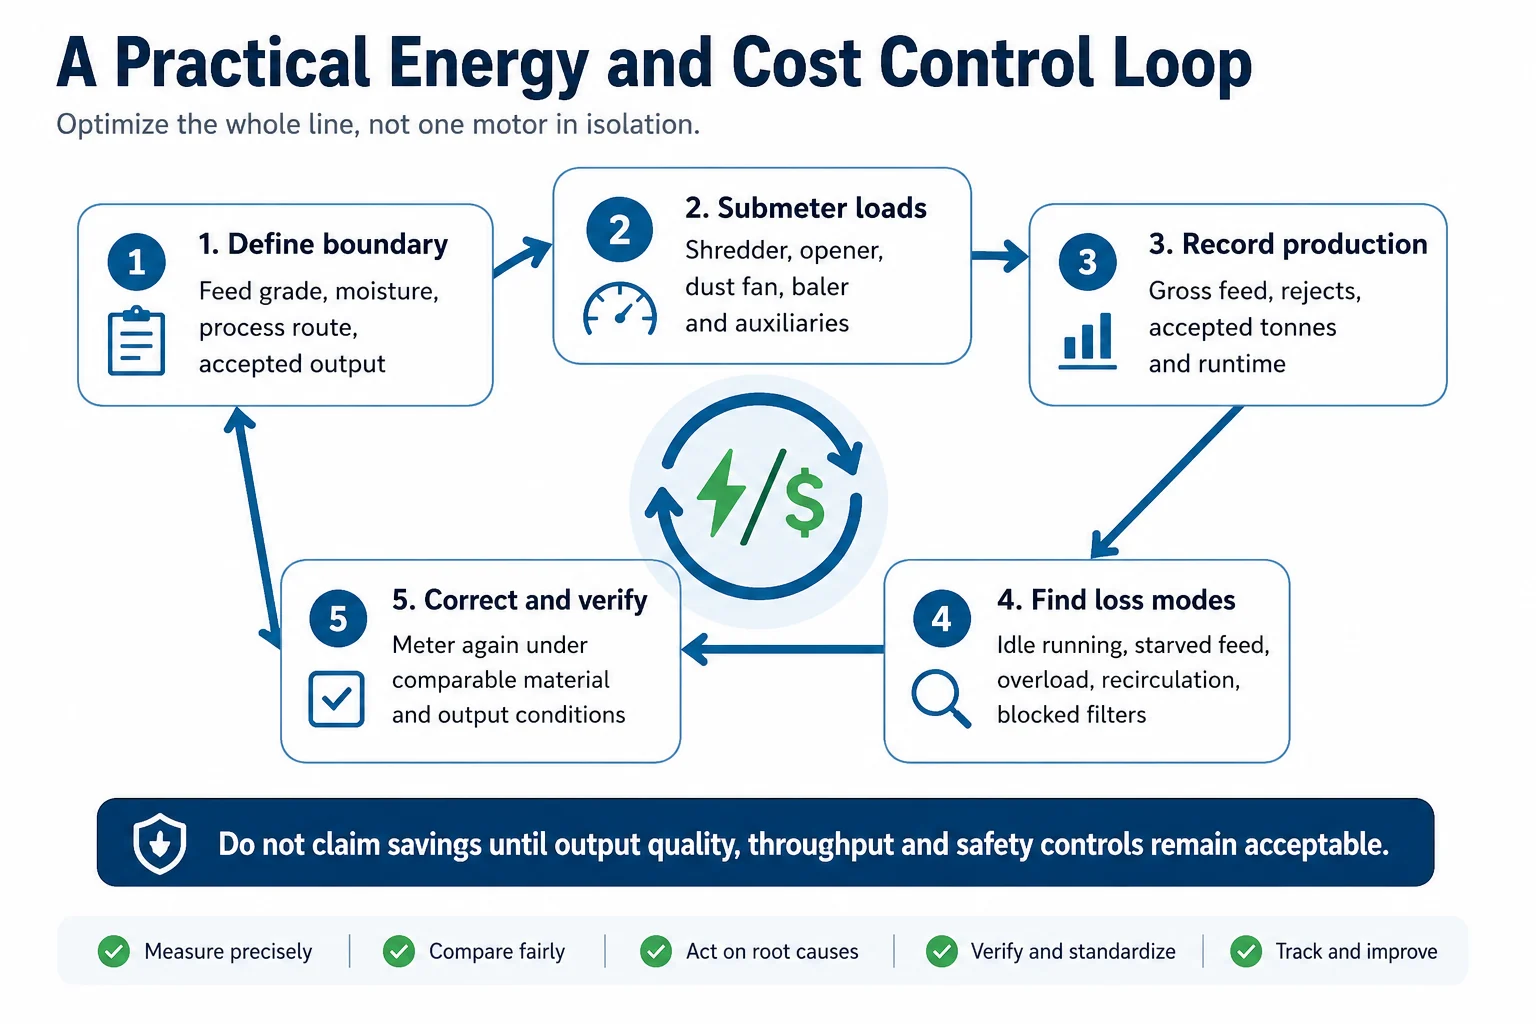
Energy reduction is useful only when accepted throughput, output quality, dust capture and safety remain satisfactory. A lower meter reading caused by starving the line is not an improvement.Measure the same material and output boundary before and after a change. Otherwise, lower power may simply reflect lower production or easier feed.
Keep the main process steadily loaded
A controlled receiving conveyor and buffer can reduce empty running followed by overload. We have found that smoother feeding often improves both kWh per tonne and wear because the shredder and opener spend less time alternating between idle and shock load.
Stop equipment that has no production reason to run
Sequence conveyors so downstream equipment clears safely and then stops during extended interruptions. Use automatic standby where appropriate, but preserve the controls needed for dust extraction and safe shutdown.
Use variable speed where the load type supports it
DOE motor guidance distinguishes variable-torque fan loads from constant-torque loads such as conveyors. For centrifugal fans, modest speed reductions can produce large power reductions under suitable system conditions; constant-torque conveyors behave differently.[4] A VFD should therefore be selected from the actual duty, not added as a generic “energy saver.”
Maintain filters, ducting and pickup points
A dust fan is part of a system. Dirty filters, damaged ducting, open access doors and poorly balanced branches change static pressure and airflow. Trend fan kW and filter differential pressure together. Reducing airflow without confirming capture can create a dust and housekeeping problem.
Measure reversals and idle current
Repeated auto-reverse events can indicate unsuitable feed, poor metering, worn cutters or hard contamination. Idle current also matters in plants with long waiting periods. A short power trace linked to the stop log is more useful than a monthly bill alone.
Review the output requirement
Sometimes the line is using energy to create a finer or more opened product than the buyer requires. Confirm the acceptance specification before increasing opening intensity or adding recirculation. The waste cardboard recycling machine selection guide explains how material tests and output criteria should shape the configuration.
Maintenance, Dust Control and Safety Belong in the Cost Model
Paper dust is not only a cleaning issue. OSHA identifies paper among organic dusts that may create combustible-dust hazards when finely divided and suspended under the right conditions.[5] The appropriate hazard assessment, collection design, housekeeping and protection measures are site-specific and should be handled by qualified professionals.Jam clearing and maintenance also require a written hazardous-energy program. OSHA’s lockout/tagout standard covers servicing and maintenance where unexpected energization, startup or release of stored energy could cause injury.[6] Hydraulic balers, conveyors, shredders and rotating openers can contain electrical, hydraulic, mechanical, gravity and stored-pressure hazards.These controls have operating consequences: authorized-person training, planned isolation points, inspection time, spare filters, housekeeping labor and safe access all cost money. Excluding them from a budget does not make the cost disappear. It only moves it into downtime, risk or an emergency invoice.
Track maintenance by cause, not only by part
A replaced belt is a cost record. The reason it failed is an improvement record. Link parts and labor to categories such as contamination impact, misalignment, lubrication, normal wear, overload, poor housekeeping or operator intervention. After several months, the plant can distinguish unavoidable wear from a repeatable process loss.
Operating-Cost Data to Request in an RFQ
A supplier cannot responsibly guarantee universal operating cost because electricity rates, wages, contamination, output requirements and working hours vary. The supplier can still provide the engineering data needed to build a defensible model.
Complete motor list: rated kW, efficiency class where specified, starting method, control method and operating sequence.
Process boundary: identify whether the proposal includes bale opening, sorting, shredding, magnetic separation, dry opening, dust collection, light-reject separation and baling.
Representative material test: record feed grade, loose or baled condition, moisture, contamination and maximum size.
Metered test data: total line kWh, average and peak kW, runtime, gross feed, rejects and accepted output.
This assumes every motor runs at rated load for the entire shift. Use a load schedule for planning and measured input for verification.
Ignoring demand charges
A plant can reduce kWh and still pay a large monthly demand charge. Review the actual tariff and interval peak.
Dividing by gross wet feed
This understates the cost of producing compliant output when moisture and rejects are significant.
Using one labor number for every configuration
Loose warehouse boxes, wired bales and contaminated mixed paper have different inspection and handling requirements. Automation level alone does not define staffing.
Treating maintenance as a fixed percentage of purchase price
A percentage may support early screening, but contamination, working hours, cutter duty, filter loading and local service access determine the actual result.
Comparing lines with different process boundaries
A shredder-and-baler system should not be compared directly with a line that also opens fiber, removes light rejects and collects dust unless the added functions are valued separately.
Assuming the lowest power proposal has the lowest cost
Lower installed power may mean better design. It may also mean a smaller machine, less dust-control capacity or a different output specification. Compare measured kWh per accepted tonne under representative conditions.
Get an Operating-Cost Model for Your Cardboard Feed
Send material photos or video, loose or baled condition, typical moisture and contamination, required accepted output, working hours, local voltage and tariff structure, workshop layout and final product requirement. YUXI can define the equipment boundary and provide the motor and process data needed for a project-specific power and operating-cost estimate.
Cardboard Recycling Plant Cost and Power FAQ
How much electricity does a cardboard recycling plant use?
There is no universal kWh-per-tonne value. Consumption depends on the process boundary, feed form, moisture, contamination, output specification, utilization and equipment control. Measure total line kWh and divide it by accepted output under documented conditions.
Can I estimate electricity use from installed motor power?
Installed power is useful for preliminary electrical design, but it normally overstates actual energy if multiplied by all operating hours. Use expected load factors for planning and verify the result with metered input power, runtime and production.
What is the best energy KPI for an OCC recycling line?
Use total line kWh per accepted tonne, accompanied by feed grade, moisture, gross throughput, reject rate, runtime and output specification. Machine-only kWh can diagnose one stage, but it does not represent complete-line performance.
Does a larger shredder always use more electricity per tonne?
No. A larger machine may have higher instantaneous demand but lower kWh per tonne when it is properly loaded and produces more accepted output. An oversized machine running starved can be inefficient. Compare measured specific energy under the same material and output conditions.
Which machine usually consumes the most power?
The answer varies by configuration. The primary shredder, dry fiber opener, dust fan and hydraulic baler can all be significant loads. A connected-load schedule and submetering are needed to identify the dominant user in the actual plant.
What costs should be included besides electricity?
Include direct labor, material handling, maintenance labor, wear parts, baling wire, filter media, lubricants, hydraulic oil, reject transport and disposal, facility overhead, safety and compliance work, and the cost of downtime or recovery overtime.
How can a plant reduce kWh per tonne?
Maintain steady feeding, avoid unnecessary idle running, correct repeated reversals, maintain dust filters and ducting, use suitable variable-speed control, measure stage loads and avoid processing the material more intensively than the buyer requires. Verify that throughput, output quality and safety controls remain acceptable.
What information should a supplier provide for an operating-cost estimate?
Request the complete motor list, control logic, representative material-test conditions, total line kWh and peak kW, gross feed, rejects, accepted output, staffing boundary, wear parts, consumables and the assumptions behind productive runtime.
David focuses on industrial shredding and recycling equipment,including material evaluation,shredder selection,process configuration,and recycling line planning.
Speak To Our Shredder Machine Expert
Get in touch with our nice team today to get a price estimate for a shredder machine.

 English



 Fast Delivery
 Reliable
 Certified
 Experienced